Business Model
Since 2021, Amazon has been monitoring sellers more strictly, and very many sellers have been affected, with funds frozen and even accounts closed. In the future, boutique and branding has become an important trend. For new e-commerce companies, “positioning business model” is also set up as the first step in the selection process.
The first thing to consider is the business model
| Boutique | Branding | |
| Supply | Product labelingFactory Supply | Self-developedFactory Customization |
| Produt | Product labelingFactory Supply | SerializationBranding |
| Platfrom/Market | Third-party e-commerceCrowdfunding platforms | Omni-Channel |
| Traffic | In-platform traffic, such as search, ads | Multichannel Marketing |
Then, consider the business strategy
| Multi-brand | Individual Category | Single SKU | |
| What | Create a product and brand matrix by demographic, Enhance product premiums through brand power | Subdivision of categories, in-depth creation of products to serve different consumer scenarios | Product with unique innovations, exclusive technologies, and new consumer needs |
| How | Multi-category help each other and cross-traffic | Build core products first, then use supply chain capabilities to expand the category | In-depth research, continuous iterative optimization |
| Advantages | Broad influence and mutual help | Category and Industry Expertise | Crowdfunding Unicorns |
| Disadvantages | Requires a large and experienced team and high operating costs | Clearly defined products roadmap | High risk and the need for continuous product innovation capabilities |
Market Insight
Market insights to identify market opportunity points by studying the market size and development of the category.
First, we can get the market data and reports from the following websites
- https://www.statista.com/
- https://www.marketplacepulse.com/
- https://www.researchandmarkets.com/
- https://www.businesswire.com/portal/site/home/
Then use the Ansoff matrix to identify the most attractive categories
Fill in the market size and annual growth of the categories into the Ansoff matrix, and select the top 3-6 most attractive categories in the market
| Existing Categories | Developing Categories | Undeveloped Categories | |
| category name | category name | category name | |
| Existing Markets | market sizeYOY | market sizeYOY | market sizeYOY |
| Developing Markets | market sizeYOY | market sizeYOY | market sizeYOY |
| Future markets | market sizeYOY | market sizeYOY | market sizeYOY |
Competitive Analysis
The competitive landscape depends on two main aspects:
- through the market share of the category, analysis for entry there is no space,
- by analyzing the situation of competitors swot, compared to whether the company has a competitive
We integrate data from reports of research institutions, annual reports of companies, and market channel optimization tools, and use GE models to calculate market competition
| Category | Score | ||
| Market Attractiveness | Stage | Rating Dimension | |
| M1 | Market size | ||
| Profit margins | |||
| Market growth rate | |||
| Competitive rivalry (if high, give low score) | |||
| M2+M3 | Threat of new competition (if high, give low score) | ||
| Threat of disruption (if high, give low score) | |||
| Capital cost to enter (high = good barrier) | |||
| Technology/R+D costs (high = good barrier) | |||
| Innovation required (high = good barrier) | |||
| Power of channel partners (if high, give low score) | |||
| Macroenvironment change (if high, give low score) | |||
| Government regulation (high = good barrier) | |||
| Sub-total | |||
| Enterprise Competitiveness | M3 | Brand equity | |
| Market share | |||
| Customer loyalty | |||
| Innovation + R&D | |||
| Product differentiation | |||
| Logistics/production expertise | |||
| Channel relationships | |||
| Strategic alliances | |||
| Strategic/marketing expertise | |||
| Strong capital + cash flows | |||
| Big data access + usage | |||
| Sub-total | |||
GE Example

Calculate cost and profit
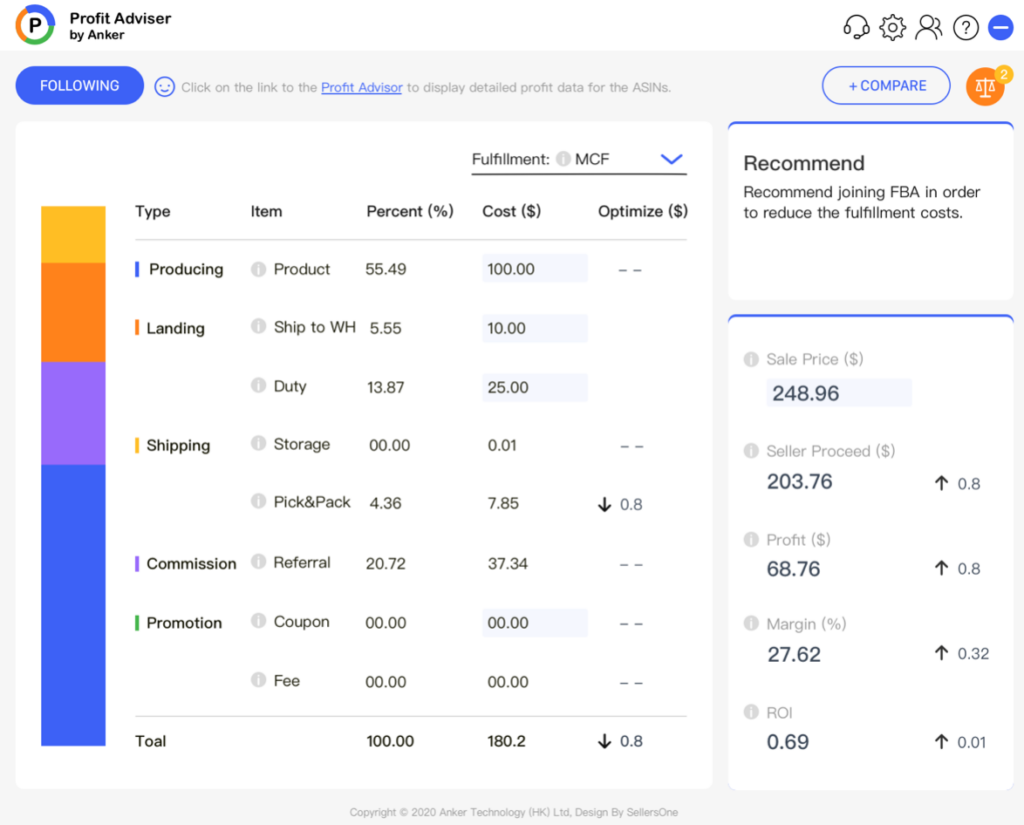
Once we have identified the category on the GE chart, we also need to use the tool to try to calculate the cost and profit for new categories that have never been explored before. For example, we need to look at the average cost of BSR 5, or even BSR 100 products sold on amazon. Amazon’s cost structure is divided into: manufacturing costs, freight costs, warehousing and logistics costs, transaction commission, marketing discounts and traffic promotion.
In general, we can use tools to determine the cost structure of the product.

Find product design opportunity
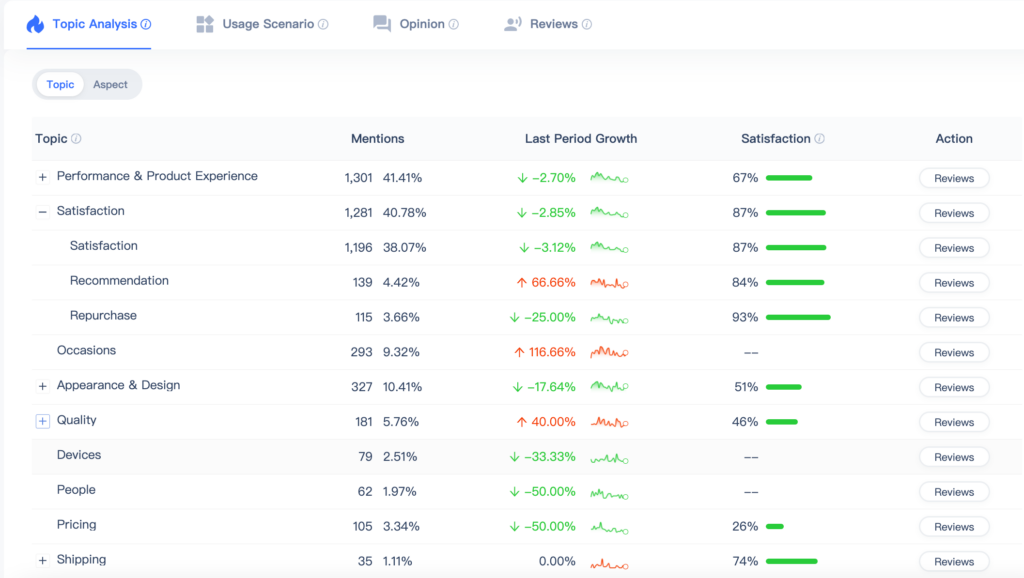
Finally, we need to look at the product in the consumer satisfaction, concerns and expectations. Here, we need to use the VOC methodology and tool to look at negative customer review analysis, expectations and search trends to find opportunities.
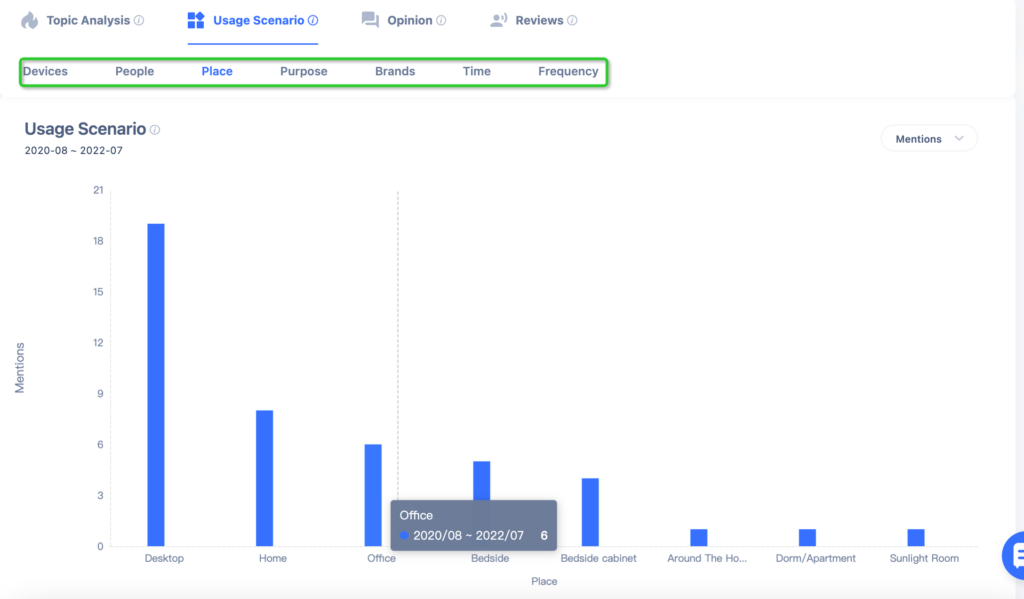
Compare customer needs scenarios with actual product scenarios to see if there is a gap
For example: see if there is “unsatisfied” between customer needs and existing products in terms of device, people, location, and target dimensions

Compare the competitors swot on the market to find the most unsatisfactory pain points of customers

Use search engine trends to find the evolution of consumer needs
In summary, the five-step method of product selection is a combination of multiple scientific methodologies. Using data and models, we first conclude what business model to choose and what category and sales channel to choose. Then determine the product from the perspective of competitors swot analysis, cost and profit, and consumer demand.