This report provides a brief analysis of the pickleball equipment market on Amazon’s US marketplace. It covers market trends, product analysis and recommendations, consumer insights, and other valuable information for stakeholders in the cross-border industry on Amazon.
Contents
- I Introduction
- II Marketing Analysis
- III Product Research
- IV Competitive Analysis
- V Feasibility suggestion
I. Introduction
Pickleball, also known as “pickleball,” is a sport that originated on Bainbridge Island in Seattle, USA. It combines elements of tennis, badminton, and table tennis. It is popular among people of all ages and genders due to its fast-paced nature, low cost, and relatively low intensity. Pickleball is not affected by water or wind, and it is easy to play on similar courts to tennis, making it accessible even outdoors.
According to statistics from the US Pickleball Association, there were only 4.82 million pickleball players in the United States at the beginning of 2021. However, by early 2023, the number of players had reached 36 million, making it the fastest-growing sport in the United States over the past three years.
The market size of Pickleball is moderate, with annual sales reaching $80 million in 2022. The performance of new products is promising, but there are challenges such as high patent qualification requirements, limited supply chains, and low gross profit. Sellers need to consider their own circumstances to determine whether it is suitable to enter the market.
|
Strengths |
Weaknesses |
|
The market has a fast growth rate, with an annual growth rate of over 20%. 23% of the TOP100 are new products, which are relatively easy to enter. The market size is moderate, and good sales can still be achieved even without being in the TOP100. Brand sellers have few products, and basically only 1-2 products perform well, without a monopoly. The product return rate is low, only 4.9%, and the after-sales cost is controllable. |
Most of the products are meticulously crafted with A+ quality and have videos and highly detailed images, surpassing the standards of typical categories. The supply chain is difficult to find due to technological or material barriers, making it more suitable for factory-type sellers with research and development capabilities or sellers with scientific and technical expertise. There are limited options for logistics, with sea freight being the most likely option, but there is a possibility of stock shortages. There are already many existing patents, and it is expected that there are still many patents currently being applied for. |
|
Opportunities |
Threats |
|
The market is in the early stage of development, with immature leading brands and consumers lacking strong brand awareness. The difference between new and old sellers is not significant. Products are relatively ordinary and can be developed through materials or intelligent functions. In addition to mainstream styles, many peripheral products have also been driven. |
The following content translated into English: Product requires qualification verification. High PPC bidding and marketing promotion fees. There may be seasonality, but currently, seasonality is not significant. |
II. Marketing Analysis
The basic market situation
The average monthly sales volume of the top-listed product is 8,160 units, and the average monthly sales volume of new products is also impressive at 1,523 units. The overall market demand is significant.
The average price of new products is $51.34, which is not significantly different from the average price of $52.68 for the top 100 products. There is no obvious price competition between new and old products.
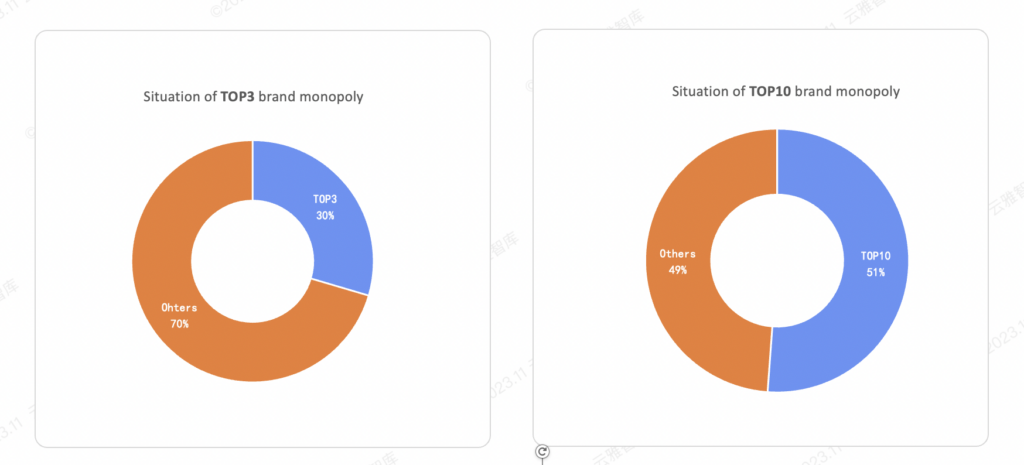
Considering the data on monopoly, product concentration, and brand concentration, there is no obvious monopoly, and the market competition environment is friendly.
|
All Listing(in 6 months) |
|
|
Total items |
3,013 |
|
Return rate |
4.9% |
|
Search for purchasing ratio |
4.6‰ |
|
Top 10 Listing |
|
|
Monthly sale |
8,160 |
|
Monopoly level |
3 |
|
Average monthly revenue |
$270,944 |
|
New Listing (Launched within 6 months in TOP100) |
|
|
Number/Proportion of New Products |
23 (23%) |
|
Average monthly sale |
1523 |
|
Sales proportion |
16.4% |
|
Average monthly revenue |
$70,919 |
|
Average price |
$51.34 |
|
Listing Sample(TOP100) |
|
|
Basic Information |
Products: 100; Brands: 65; Sellers: 49 |
|
Sellers |
FBA: 81%; AMZ: 12%; FBM: 7% |
|
Monthly Sale |
213,248 |
|
Average monthly sale |
2,132 |
|
Monthly Revenue |
$96,864 |
|
Average Price |
$52.68 |
|
Average Reviews |
1,109 |
|
Average Ratings |
4.6 |
|
Average gross profit margin |
63% |
|
Listing Sample(TOP100) |
|
|
Average Seller Number |
2.3 |
|
A+ proportion |
92% |
|
Product concentration |
38% |
|
Brands concentration |
53% |
|
Seller concentration |
74% |
|
Seller’s location |
China:57% ; USA:37% |
Category keywords Google Trends
Keywords include:
- pickleball paddles
- pickleball
- pickleball set
- pickleball balls
- pickleball bag
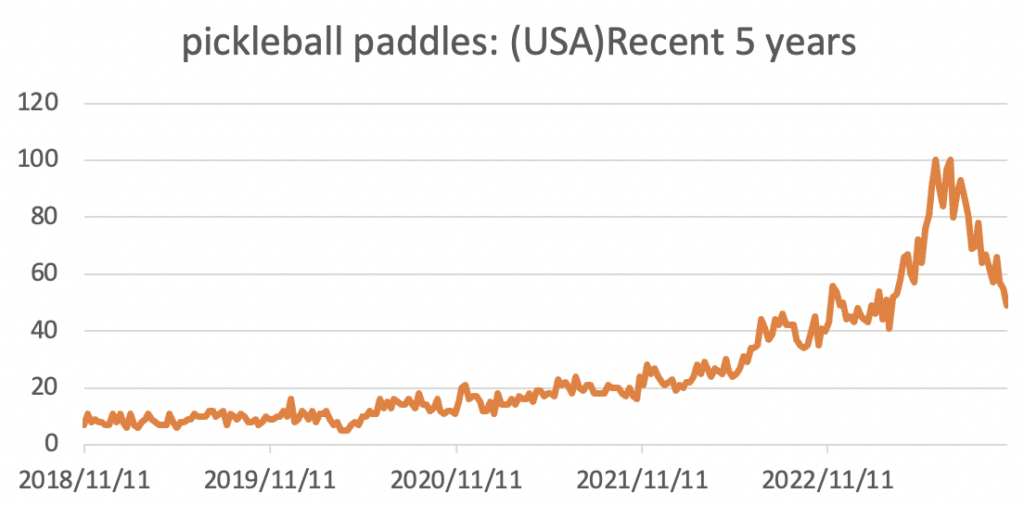
Before 2022, the search popularity was very low. Starting from April 2022, the search index surged rapidly, and then began to decline from July 2023.

Category Keyword ABA Ranking Trend
According to the ABA ranking trend based on category keywords, there will be a peak in the months of June to September, while December and March will experience a slight dip. However, the ABA ranking remains high throughout the year, indicating a strong market demand for Pickleball equipment year-round.
Considering Google Trends, the keyword search volume has shown a steady upward trend in recent years. After the summer of 2023, there is a slight decrease in search popularity, suggesting some seasonality. Further analysis should be conducted by incorporating subsequent data or closely monitoring market performance.
|
Keywords |
2022 |
2023 |
||||||||||
|
11 |
12 |
1 |
2 |
3 |
4 |
5 |
6 |
7 |
8 |
9月 |
10月 |
|
|
pickleball bag |
16,612 |
13,178 |
17,499 |
15,492 |
18,481 |
14,556 |
11,252 |
9,332 |
9,257 |
12,769 |
10,971 |
12,165 |
|
pickleball balls |
12,039 |
16,519 |
15,332 |
13,446 |
9,101 |
6,212 |
6,505 |
3,794 |
3,848 |
5,394 |
5,250 |
6,570 |
|
pickleball paddle |
16,969 |
19,530 |
14,395 |
13,813 |
19,934 |
13,553 |
7,635 |
9,063 |
7,534 |
6,365 |
8,926 |
12,525 |
|
pickleball paddles |
1,541 |
2,394 |
1,742 |
1,128 |
1,034 |
602 |
622 |
292 |
324 |
540 |
285 |
890 |
|
pickleball paddles set of 2 |
48,430 |
57,944 |
61,627 |
53,857 |
62,768 |
38,793 |
47,716 |
9,890 |
12,680 |
3,117 |
1,341 |
3,426 |
BSR sales and competitive situation
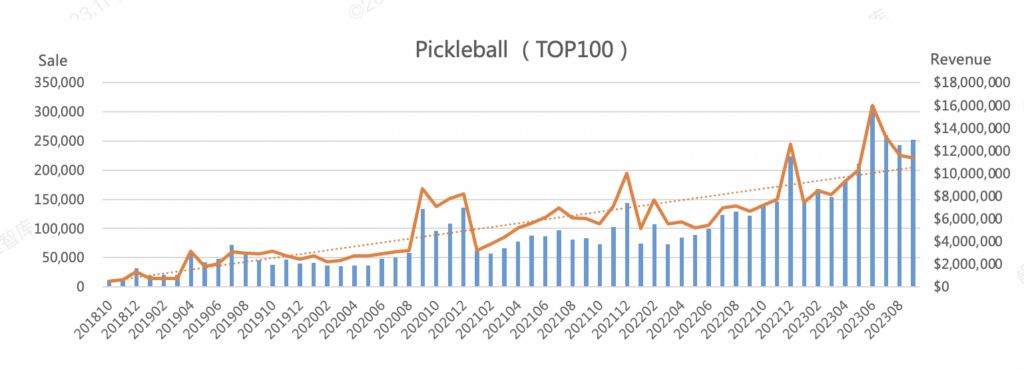
In terms of monthly sales, there is a clear upward trend. The monthly sales have increased from 500,000 in October 2018 to 16.01 million in June 2023, showing a rapid growth.
Looking at the entire year, the overall annual growth rates from 2020 to 2022 were 59.81%, 27.19%, and 35.59% respectively. Pick ball equipment has been steadily and rapidly growing in the US market every year.
In terms of the number of product categories, it has increased from around 1,000 in 2021 to about 2,400 in 2023, indicating that many sellers are actively entering the market.
Summary

In summary, the rapid growth in sales of Li-Ning badminton equipment is due to the popularity of the sport, which has further increased consumer demand.
Although the history of this sport’s development is relatively short, as time goes on, there is still a vast potential for consumer demand for Li-Ning badminton products.
Players’ requirements for badminton equipment will also continue to rise. Therefore, sellers can focus on product innovation, comfort, quality, and other aspects when it comes to mainstream styles like Li-Ning badminton sets. They can also adopt a scenario-based approach to develop more peripheral styles and explore new opportunities for growth. Many advanced players may have specific requirements for rackets, hoping to enhance their fine techniques and feel through the use of high-quality rackets.
III. Product Research
Pickleball Set Style Analysis:

- In terms of product combination, it usually consists of Pickleball, paddles, ball bags, grip tapes, etc., which can be freely combined.
- In terms of product material, it is usually made of wood, fiberglass, carbon fiber, and mixed materials.
- In terms of product style, the style is usually modern, simple, practical, and highly functional.
- In terms of product color, the colors are usually solid and printed colors, such as rainbow Pickleball sets, cartoon Pickleball sets, etc.
- In terms of user groups, the user groups are usually professional athletes, amateur enthusiasts, teenagers, and the elderly.
Product Operations Analysis
The sales trend chart shows that the sales of Peak ball sets started to rise in 2021 and reached its peak in 2023. The reason for the increase in sales could be the growing popularity of Peak ball sports worldwide.
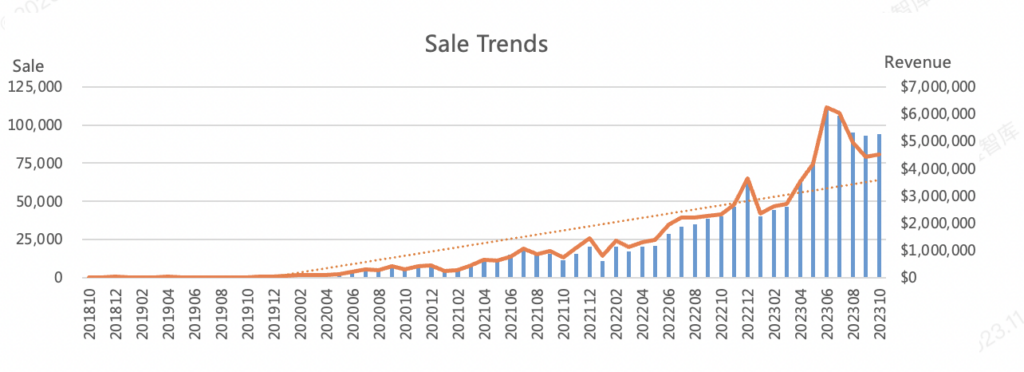
The price trend chart shows that the price of the Pick ball set remained relatively stable and even slightly increased in the past two years. However, there was a fluctuation in the price in 2022, possibly due to a decline in the popularity of Pick ball sports, leading to a change in the supply and demand relationship. However, by the end of 2023, there was a slight recovery in the price.
The obvious upward trend in ratings, coupled with a steep slope, indicates that the user experience and feedback for the Pickleball Set are constantly improving. Sellers can take advantage of this opportunity to upgrade their products, find untapped market demand, and seek growth points.

Price Analysis
Product price range distribution: Most of the products are distributed in the price range of $20-$79.99, with only 3 products priced below $20 and only 1 product priced above $80. In addition, the average sales distribution of each price range is even, with slightly lower sales in the $60-$59.99 range.
New product price range proportion: New products are concentrated in the price ranges of $20-$39.99 and $40-$59.99, with a balanced proportion of new products in each range. Therefore, pricing can be chosen within this range.
|
Price |
ASIN |
New Asin |
Monthly Sale rate |
Average Sale of Single Asin |
|
$0-$19.99 |
6.7% |
2.2% |
7.3% |
2,201 |
|
$20-$39.99 |
44.4% |
17.8% |
54.3% |
2,460 |
|
$40-$59.99 |
31.1% |
13.3% |
21.4% |
1,381 |
|
$60-$79.99 |
15.6% |
0.0% |
14.9% |
1,929 |
|
$80以上 |
2.2% |
0.0% |
2.1% |
1,897 |
Brands Analysis
In the performance of the Pickleball set brands, only 4 brands have multiple ASINs entering the TOP100, while other brands have single ASINs entering. The monthly sales volume of these brands is above 2500 units, indicating a considerable market size.
MTEN, CN, a seller from Guangdong, has a relatively new store and focuses on a vertical product line. They rely solely on one product to gain a high market share.
Niupipo, CN, another seller from Guangdong, has been in operation since 2012. They are a professional company specializing in sports research and development. They collaborate with professional athletes and have a deep understanding of product requirements. They possess advanced technology and excellent materials, showcasing a strong supply chain capability.
|
Brands |
ASIN |
Monthly Sale |
Rate |
Monthly Revenue |
Rate |
|
MTEN |
1 |
10,917 |
12.06% |
$436,571 |
10.62% |
|
niupipo |
2 |
8,040 |
8.88% |
$379,500 |
9.24% |
|
tearplex |
1 |
5,422 |
5.99% |
$97,542 |
2.37% |
|
Panel Sound |
1 |
5,146 |
5.68% |
$205,583 |
5.00% |
|
Asbocer |
1 |
4,417 |
4.88% |
$176,636 |
4.30% |
|
JoncAye |
2 |
4,383 |
4.84% |
$289,591 |
7.05% |
|
VINSGUIR |
2 |
4,221 |
4.66% |
$144,370 |
3.51% |
|
YC DGYCASI |
2 |
3,887 |
4.29% |
$166,619 |
4.05% |
|
Uteeqe |
1 |
3,756 |
4.15% |
$262,845 |
6.40% |
|
Selkirk Sport |
1 |
3,288 |
3.63% |
$263,007 |
6.40% |
|
OLANNY |
1 |
3,159 |
3.49% |
$145,282 |
3.54% |
|
GARYE |
1 |
2,716 |
3.00% |
$133,057 |
3.24% |
|
ErPils |
1 |
2,631 |
2.91% |
$65,749 |
1.60% |
Situation of TOP3 brand monopoly
The top three brands in the category account for 30% of the total sales, while the top ten brands account for 51% of the sales. There isn’t a significant monopoly effect, which means there are plenty of opportunities for both new and existing sellers to grow and develop.
Category Brand Sales
|
Rank |
Brands |
Asins |
New Asins |
Monthly Sale |
Brands Sale |
Avg Price |
Ratings |
Reviews |
|
1 |
Franklin Sports |
4 |
0 |
37,851 |
1,031,518.26 |
18.87 |
4.5 |
3232 |
|
2 |
niupipo |
7 |
1 |
18,531 |
777,794.71 |
48.56 |
4.6 |
7303 |
|
3 |
MTEN |
1 |
0 |
10,987 |
439,370.16 |
39.99 |
4.9 |
1172 |
|
4 |
JOOLA |
7 |
1 |
9,593 |
1,344,108.77 |
132.57 |
4.5 |
758 |
|
5 |
VINSGUIR |
5 |
2 |
6,939 |
289,192.62 |
41.95 |
4.6 |
971 |
|
6 |
Asbocer |
2 |
1 |
6,620 |
211,861.81 |
27.99 |
4.6 |
638 |
|
7 |
tearplex |
1 |
0 |
5,710 |
102,722.90 |
17.99 |
4.7 |
272 |
|
8 |
Selkirk Sport |
3 |
1 |
5,696 |
543,886.50 |
106.66 |
4.6 |
594 |
|
9 |
Onix |
3 |
0 |
5,477 |
317,698.22 |
40.27 |
4.6 |
1108 |
|
10 |
Panel Sound |
1 |
0 |
5,140 |
205,343.00 |
39.95 |
4.7 |
453 |
Among the top brands in the TOP100 products, Franklin Sports currently leads with a 17.71% share of monthly sales and a 10.58% share of monthly revenue, ranking below JOOLA. Niupipo and JOOLA also have relatively high monthly sales shares. Upon closer observation, it appears that these two brands have achieved some success in product innovation.
New style inspiration

- Women’s exclusive Pickleball
- Pickleball paddles and bags designed specifically for women can attract more female participation. For example, a pink Pickleball paddle can make women feel more confident and elegant, while also adding a touch of fashion and trendiness to the sport of Pickleball.
- Children’s specialized Pickleball paddles
- Children have different physical characteristics and strength compared to adults, so Pickleball paddles need to be designed accordingly. Children’s specialized Pickleball paddles are usually lighter, shorter, and have wider grips, making it easier for children to control the paddle. Additionally, the colors and patterns of children’s Pickleball paddles should be more lively and cute to make them more appealing to children.
- Technological innovations
- Innovative materials: Pickleball paddles can be made using lighter and more durable materials, making them more flexible and extending their lifespan.
Smart features: Pickleball paddles can incorporate smart features such as scoring, step counting, and distance measurement, making it more convenient for players to train and compete.
IV Competitive Analysis
Customer Profile
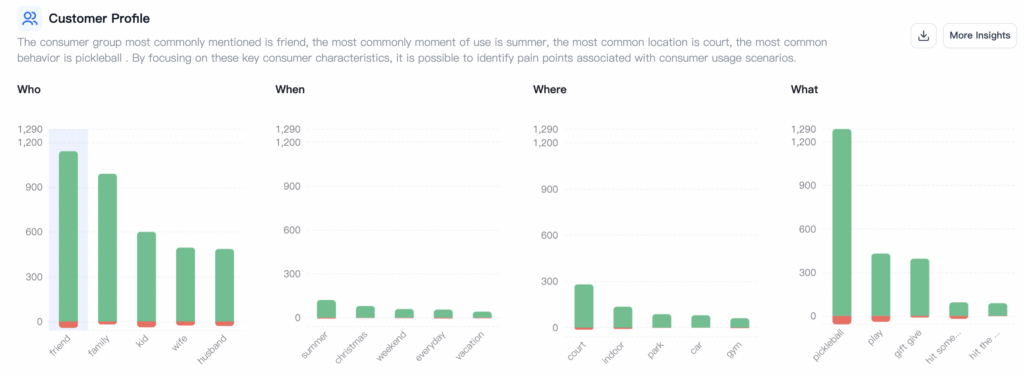
From the basic audience profile, we can see that:
- In usage scenarios, playing pickleball is a frequently mentioned keyword, reflecting that consumers tend to engage in entertainment rather than competition; engaging in fun and casual activities is the main driving force for purchases.
- Gifts are also frequently mentioned, reflecting that pickleball sets are often purchased as gifts and given to family members, expanding the potential target customer base.
- Among the audience relationships, friends are the most frequently mentioned keyword, highlighting the strong social appeal of this category; family members are also frequently mentioned, reflecting the universality of intergenerational play within families.
- The usage of this category often concentrates in the summer, reflecting that it can be a popular outdoor activity during the summer; weekends, holidays (Christmas, Easter), and other leisure periods also receive high ratings.
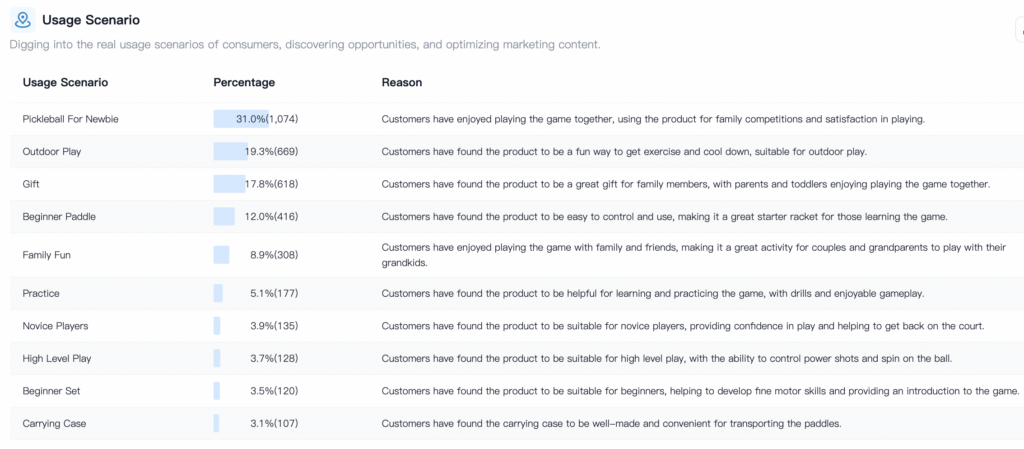
Usage Scenario
The target audience for beginners is the largest user group, and they require equipment that is easy to get started with and learn. It is worth considering designing simple and practical products for beginners.
Outdoor recreation and family entertainment are the main usage scenarios, reflecting the need for multi-generational play and relationship building. This can be achieved through marketing communication and customized products.
The core selling price for this category is $29-69 USD. Once the price exceeds $69 USD, the proportion of users purchasing in various scenarios decreases significantly. On the other hand, there are hardly any user choices below $29 USD. Overall, users of this product category tend to choose prices that are moderately higher to ensure quality assurance.
In outdoor summer scenarios, the preferred price range is $40-50 USD, slightly higher compared to the price range for personal use. For daily (weekly, daily) usage scenarios, the price range can be slightly higher as well. The user base consists of experienced Pickleball players.

Customers’ satisfaction and dissatisfaction
The most core requirement of users for this category is quality, but the most serious product complaint is that it is not durable, which was mentioned by nearly 33% of users. Such a high proportion of unified complaints should be taken seriously.
Other complaints are all focused on quality issues, such as poor materials, difficult to control, short handles, poor bouncing effects, and so on. Users have a low tolerance for these faults.
The key factors for positive reviews from users in this category are grip, lightweight, and entry-level aspects. These key factors have a very high proportion, so it can be seen that users’ demands for this category are very clear and simple, without too many demands for product styles or designs.
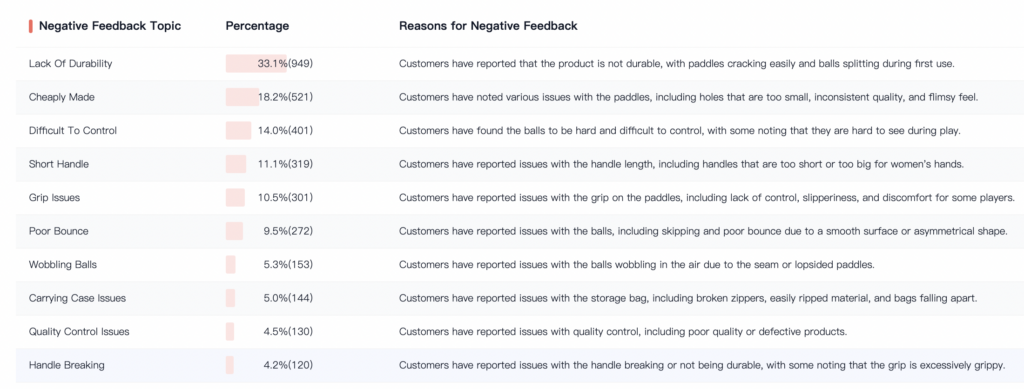
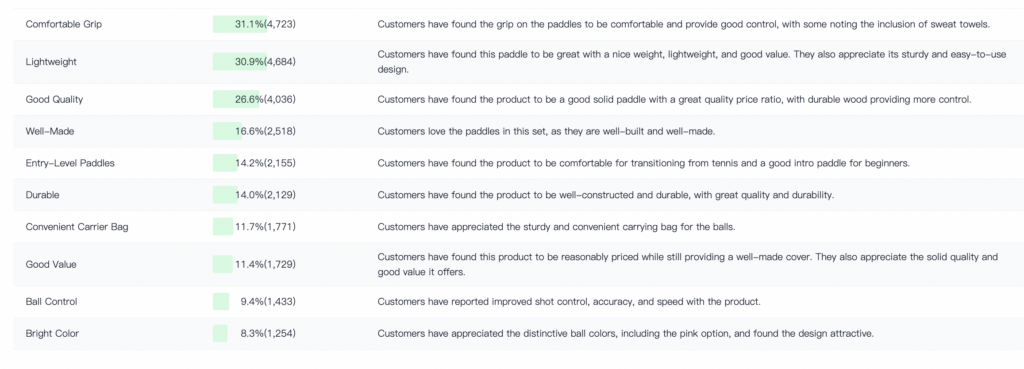
The user focus of this category is highly concentrated: durability, weight, and suitability for outdoor scenes.
During the product selection process, we need to strictly control durability and weight to reduce negative reviews and increase satisfaction. Additionally, choosing materials or features suitable for beginners can increase positive reviews.
During product operation, we should emphasize the advantages of durability and quality, while also highlighting the leisure activities that can be enjoyed with family and friends.
Customer Expectation
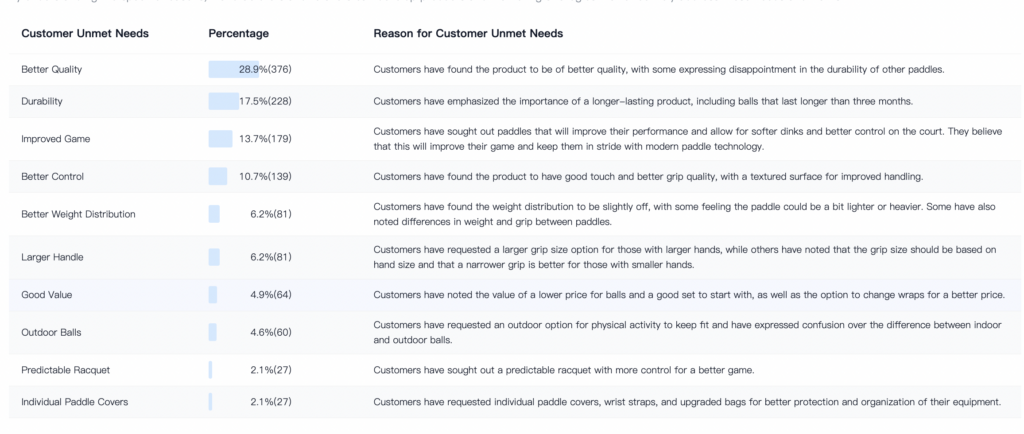
From the unmet needs of users, it can be seen that their focus is also centered around three fundamental attributes: durability, weight, and maneuverability.
BSR Product Attribute Analysis
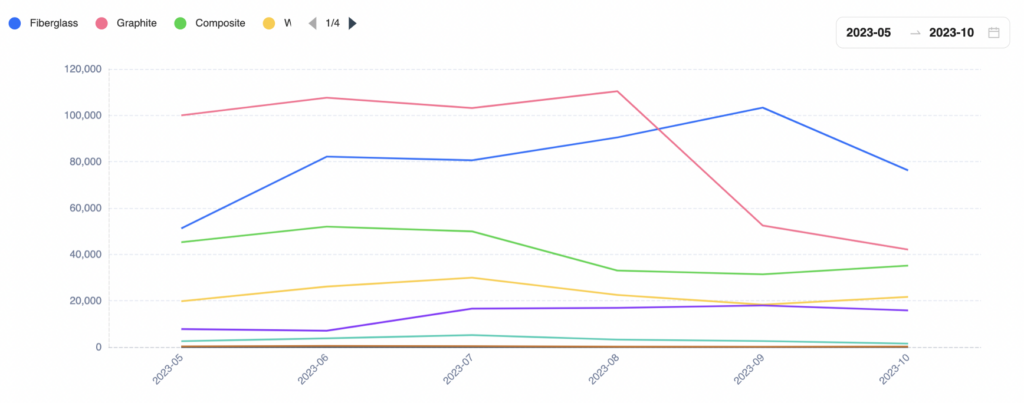
From the proportion of BSR product attributes, it can be seen that the materials in this category are usually concentrated in several types, such as fiberglass, carbon fiber, and synthetic materials.
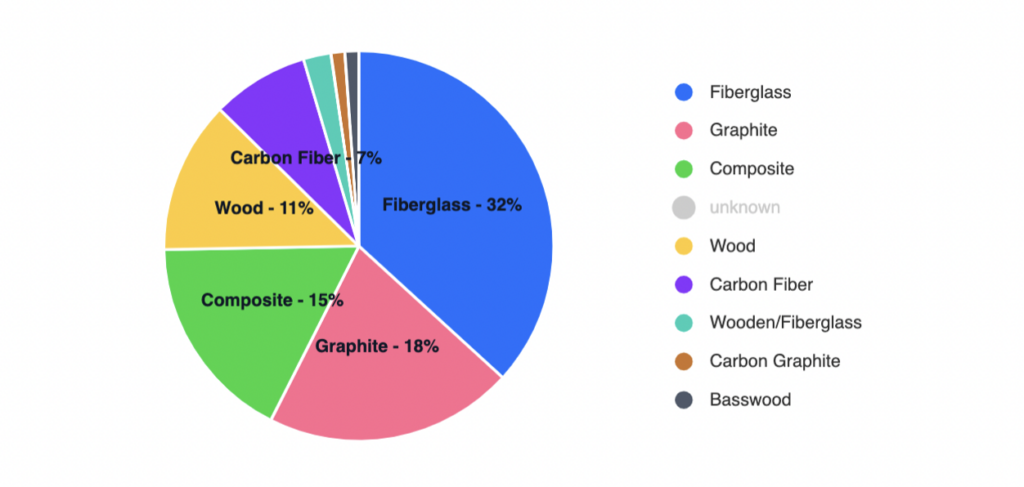
From the sales trend of BSR product attributes, it can be seen that the glass fiber material type of this category is on an upward trend in 2023, while carbon type products are declining in September.
V. Feasibility suggestion

Product Selection Recommendations
- Strictly control product quality, focus on durability, weight, and controllability.
- Choose materials with high durability, such as fiberglass and carbon fiber; weight in the medium-lightweight range.
- Choose product types suitable for beginners and hobbyists; provide portable and sturdy carrying bags.
Marketing and Promotion Suggestions
- Emphasize the advantages of being lightweight, durable, and easy to grip, conveying a sense of high quality.
- Focus on promoting during summer, holidays, and other key time periods. Target leisure and entertainment scenarios for families and friends, with teenagers’ households as the primary audience.
Operational Optimization Suggestions
- Introduction to enhancing the atmosphere of leisure and social scenes such as family and friends.
- Adding applicable tutorials and improving user experience to reduce the difficulty of operation for beginners.
- Strengthening quality management to increase positive reviews; optimizing product packaging to increase portability.
Seller Sprite
SellerSprite – The Professional Amazon Keyword Optimization and Product Research Tool.

https://www.youtube.com/watch?v=HlMelNTZAd0
Shulex VOC
A SaaS platform for global voice of customer and product research. More efficient, less cost and stay ahead! It helps to ship products your customers love, 5X faster using ChatGPT. Discover a wealth of insights without lifting a finger.
